AI-Powered Observability & Debugging Tools 2026: Intelligent Fault Detection & Root Cause Analysis
Master AI-powered observability and debugging tools. Use AI to automatically detect anomalies, analyze logs, trace performance bottlenecks, and quickly identify root causes.
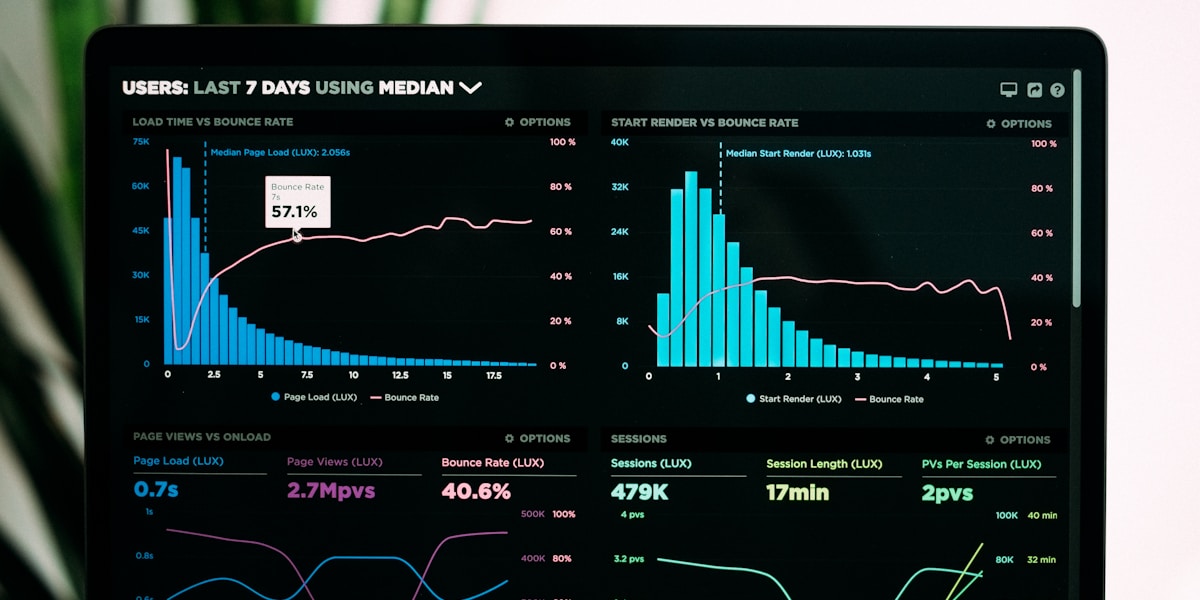
The AI Revolution in Observability
In 2026, observability and debugging have fundamentally changed. AI-powered tools can now automatically detect anomalies, analyze massive log data, trace performance bottlenecks in distributed systems, and provide root cause analysis within minutes. This isn't just about improving visibility—it reduces fault detection time from hours to minutes.
Modern AI observability tools don't just monitor metrics; they understand system behavior, learn normal patterns, detect subtle anomalies, and predict potential failures. The result is proactive, intelligent operations.
What Is AI-Powered Observability?
AI-powered observability uses machine learning to automatically analyze metrics, logs, and traces data, providing intelligent insights. Unlike traditional monitoring tools, AI-driven tools can:
- Automatically detect performance anomalies and error patterns
- Correlate multiple data sources to identify root causes
- Predict potential failures and provide early warnings
- Analyze distributed traces to identify bottlenecks
- Automatically generate incident reports and fix recommendations
- Learn system behavior patterns to reduce false positives
Leading AI Observability Tools in 2026
AI Anomaly Detection
AI anomaly detection tools use unsupervised learning to identify abnormal behavior in systems, including performance degradation, error rate spikes, and resource exhaustion.
// AI-powered anomaly detection with OpenTelemetry
const { Collector, AIAnalyzer } = require("ai-observability");

const collector = new Collector({
  metrics: ["cpu", "memory", "request_latency", "error_rate"],
  logs: ["application", "system", "audit"],
  traces: ["distributed", "database", "external-api"]
});

const analyzer = new AIAnalyzer({
  model: "anomaly-detection-v3",
  sensitivity: "high",
  prediction: true
});

analyzer.on("anomaly", (event) => {
  console.log(`Anomaly detected: ${event.type}`);
  console.log(`Root cause: ${event.rootCause}`);
  console.log(`Recommendation: ${event.fix}`);
});

collector.pipe(analyzer);
AI Log Analysis
AI log analysis tools can automatically parse, cluster, and correlate log data, identifying error patterns and extracting key information.
# AI log analysis configuration
# .ai-observability.yml
ai:
  provider: "observability-ai"
  model: "log-analyzer-pro"

analysis:
  log_sources:
    - type: "elasticsearch"
      host: "localhost:9200"
      index: "app-logs-*"
    - type: "file"
      path: "/var/log/app/*.log"
  features:
    - anomaly_detection
    - pattern_recognition
    - error_correlation
    - performance_bottleneck
  alerting:
    channels: ["slack", "pagerduty"]
    severity_threshold: "warning"
AI-Enhanced Distributed Tracing
AI-enhanced distributed tracing tools not only collect trace data but also automatically analyze performance bottlenecks and dependencies.
// Distributed tracing with AI analysis
const { trace, SpanStatusCode } = require("@opentelemetry/api");
const { AIEnhancedTracer } = require("ai-tracing");

const tracer = new AIEnhancedTracer({
  serviceName: "order-service",
  aiAnalysis: {
    enabled: true,
    detectBottlenecks: true,
    correlateWithMetrics: true
  }
});

async function processOrder(orderId) {
  const span = tracer.startSpan("process-order");
  try {
    // Business logic
    await validateOrder(orderId);
    await chargePayment(orderId);
    await updateInventory(orderId);
    span.setStatus({ code: SpanStatusCode.OK });
  } catch (error) {
    span.setStatus({ code: SpanStatusCode.ERROR, message: error.message });
    span.recordException(error);
    throw error;
  } finally {
    span.end();
  }
}
Best Practices for AI Observability
1. Collect Comprehensive Data
Ensure you collect metrics, logs, and traces data. AI tools need comprehensive data to provide accurate analysis.
2. Configure Intelligent Alerting
Use AI-driven alerting rules based on anomaly detection rather than static thresholds to reduce alert fatigue.
# AI-powered Prometheus rules
groups:
  - name: ai_anomaly_detection
    rules:
      - alert: HighErrorRateAnomaly
        expr: |
          ai_anomaly_score(
            rate(http_requests_total{status=~"5.."}[5m])
          ) > 0.85
        for: 2m
        labels:
          severity: critical
          ai_confidence: high
        annotations:
          summary: "AI detected abnormal error rate"
          description: "AI analysis indicates {{ $value }} error rate anomaly"
          root_cause: "{{ $ai.rootCause }}"
          recommendation: "{{ $ai.recommendation }}"
3. Automate Root Cause Analysis
Leverage AI's correlation analysis capabilities to automatically identify the root cause of failures, not just detect symptoms.
4. Integrate into Workflows
Integrate AI observability tools into existing workflows including Slack, PagerDuty, Jira, and other tools.
# Grafana AI Dashboard Panel
{
  "dashboard": {
    "title": "AI-Powered Observability",
    "panels": [
      {
        "type": "ai-anomaly-graph",
        "title": "Anomaly Detection",
        "targets": [
          {
            "expr": "ai_anomaly_score(cpu_usage)",
            "legendFormat": "CPU Anomaly"
          }
        ],
        "aiFeatures": {
          "showPredictions": true,
          "highlightRootCause": true,
          "autoZoomOnAnomaly": true
        }
      },
      {
        "type": "ai-log-pattern",
        "title": "Log Pattern Analysis",
        "aiConfig": {
          "clusterSimilarLogs": true,
          "detectErrorPatterns": true
        }
      }
    ]
  }
}
The Future of AI Observability
Looking ahead, AI observability will become even more intelligent. We can expect: self-healing systems, AI-driven capacity planning, automated performance optimization, predictive maintenance, and AI-based operational decisions.
Related Tools
Enhance your debugging toolkit with our JSON Formatter, Log Analyzer, Regex Tester, and Base64 Encoder.
Frequently Asked Questions
What is AI-powered observability?
AI-powered observability uses machine learning to automatically analyze metrics, logs, and traces data, detect anomaly patterns, identify performance bottlenecks, and provide root cause analysis.
Can AI automatically detect anomalies?
Yes, modern AI observability tools use unsupervised learning and deep learning to detect anomalies including performance degradation, error rate spikes, and resource exhaustion with 90-95% accuracy.
Can AI perform root cause analysis?
Absolutely. AI tools can correlate multiple data sources (metrics, logs, traces), identify the root cause of failures, and provide fix recommendations.
What data sources do AI observability tools support?
AI observability tools support mainstream monitoring and tracing systems including Prometheus, Grafana, Datadog, New Relic, ELK Stack, Jaeger, Zipkin, and more.
Can AI predict potential failures?
Yes, AI observability tools use predictive analytics to identify trends that could lead to failures, providing warnings 30-60 minutes in advance.